Data Analysis using Python Pandas - May 2016
By amolkahat, Sat 04 June 2016, in category Pythonpune
By amolkahat, Sat 04 June 2016, in category Pythonpune
Data analysis is one of the list of complicated topics. Data analysis is very vast. May Pythonpune meetup was on the basis of Data Analysis. May Pythonpune meetup was held in Amazatic Solutions, Spot 18 mall, Baner, Pune.
Sudarshan Gadhave was the speaker, he works as a Data Engineer at NEC Corporation of America. He working in this field from 3-4 years and he has a good knowledge of python, numpy, python pandas, skitit learn, and other things.
Sudarshan was started with introduction to python Numpy, and he covered the following topics:
Numpy, we can start with it. Numpy is python library which is designed to work with homogeneous multidimensional array object. It is table of numbers of same type. In Numpy dimensions are called as axes, and number of axes is rank.
For Example:
[[1, 2, 3]] is example of numpy array, in numpy language it is array of rank 1 and has axis 3. Now consider the example below, which shows the rank = 2 and axis = 3.
[[1, 2, 3], [5, 6, 7]]
Now we can technically represent it as (rank, axis) format, which is (2, 3). In short it is denote that array has rank=2 and axis=3.
In python we can define it as :
>>> import numpy as np
>>> a = np.arange(20).reshape(4, 5)  #method create array of 0 to 19, and reshape method arrange it rank 4 and axis 5 >>> a array([[ 0, 1, 2, 3, 4], [ 5, 6, 7, 8, 9], [10, 11, 12, 15, 14], [15, 16, 17, 18, 19]])
>>> a.shape                          # It will return the shape of a (4,5)
>>> a[0]                             #Example of Indexing array([0, 1, 2, 3, 4])
>>> a[0, 1:2]                        #Printing 1 from table array([1])
>>> a[0:1, 1:2] array([[1]])
>>> a[0:2, 1:2] array([[1], [6]])
>>> a[0:2, 1:3] array([[1, 2], [6, 7]])
>>> a[0:, 2:] array([[ 2,  3,  4], [ 7,  8,  9], [12, 13, 14], [17, 18, 19]])
>>> b = np.array([0, 2, 0, 1])
>>> print a[np.arange(4), b]         #printing elements in a using [ 0 7 10 16] #indexes in b
Numpy has two numaric data types. These are int64 and float64.
>>> a.dtype
dtype('int64')
>>> c = np.array([1.5, 2.5])
>>> c.dtype
dtype('float64')
You can perform Arithmetic operations on arrays:
>>> d = np.array([1.4, 2.2])
>>> print c+d [ 2.9 4.7]
>>> print c-d [ 0.1 0.3]
>>> print c*d [ 2.1 5.5]
>>> print c/d [ 1.07142857 1.13636364]
Or you can use Numpy inbuilt methods,
Pandas:
Pandas is python package which is designed to make working with "relational" or "labled" data. It is very fast , flexible and expressive data structure liberary.
Python pandas is suitable for
There are tow primary data structures of pandas,
Series:
Series is One-Dimensional array like object containg an array of data and associated array of data labels.
>>> import pandas as pd
>>> pd.Series([1,2,4]) 0 1 1 2 2 4 dtype: int64
DataFrames:
Two-Dimensional size-mutable heterogeneous tabular data structure with labled axes.
>>> data = {'City' : ['Pune', 'Mumbai', 'Delhi', 'Pune'],
... 'Year' : [2012,2013,2012,2013],
... 'Population': [2.5, 10.1, 9.5, 2.8]}
>>> df1 = pd.DataFrame(data)
>>> df1
    City   Population Year
0   Pune          2.5 2012
1   Mumbai       10.1 2013
2   Delhi         9.5 2012
3   Pune          2.8 2013
We can display Selected columns too.
>>> df2 = pd.DataFrame(data, columns=['City', 'Year'])
>>> df2
    City   Year
0   Pune   2012
1   Mumbai 2013
2   Delhi  2012
3   Pune   2013
DataFrame with indexes.
>>> df2 = pd.DataFrame(data, columns=['City', 'Year'], index=['a','b','c','d'])
>>> df2
    City   Year
a   Pune   2012
b   Mumbai 2013
c   Delhi  2012
d   Pune   2013
Plotting and Visualization:
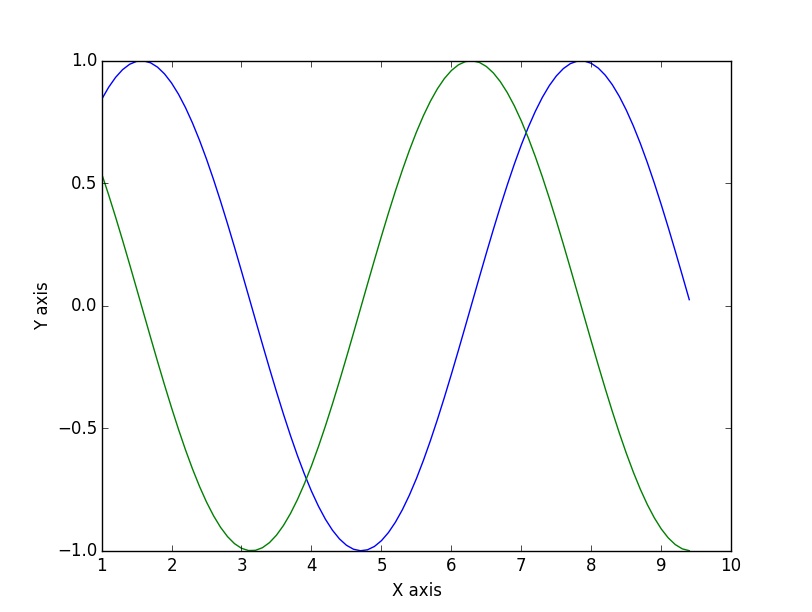
For visulaisation data python module matplotlib is used. Matplotlib is 2D plotting library wich produce different types of figures like histogram, 3D view, etc.
Here is small example:
>>> import matplotlib.pyplot as plt
>>> d = np.arange(1, 3 * np.pi, 0.1)
>>> sin_d = np.sin(d)
>>> cos_d = np.cos(d)
>>> plt.plot(d, sin_d)
>>> plt.plot(d, cos_d)
>>> plt.xlabel("X axis")
>>> plt.ylabel("Y axis")
>>> plt.show()
 Output of above code.
That was awesome, that was an interesting topic. Thanks Sudarshan for this wonderful talk.
Thanks Amazatic Solutions for providing venue and arrangements.
Thanks Chandan Kumar for arranging this wonderful session.